El año 2012, de acuerdo con los datos estadísticos obtenidos de la AEAT/Departamento de Aduanas de la Agencia Tributaria de España, las exportaciones gallegas de ropa (CNAE 14 confección de prendas de vestir) fueron de 3.177 millones de euros, lo que supone un incremento del 15 % con respecto al año anterior.
Como puede verse en la siguiente tabla, supone además el mayor incremento de los últimos años, donde la media de crecimiento estaba sobre el 8 %.
Incremento en el número de empresas exportadoras
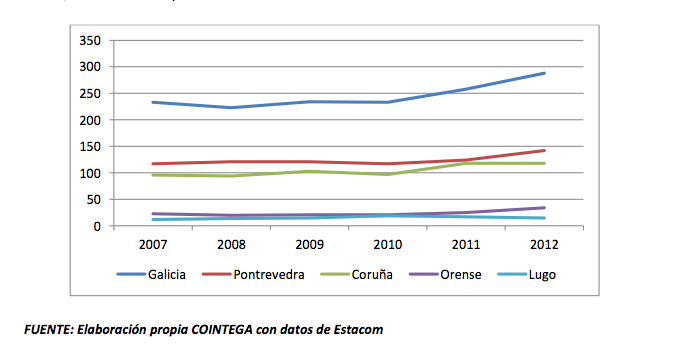
Otro dato igual de relevante es el continuo incremento en el número de empresas que han realizado alguna exportación, que en el año 2012 ha alcanzado la cifra record de 288 empresas.
El siguiente gráfico muestra el número de empresas que han realizado alguna operación de exportación desde alguna provincia gallega, referida a productos comprendidos dentro del CNAE 14, confección de prendas de vestir.
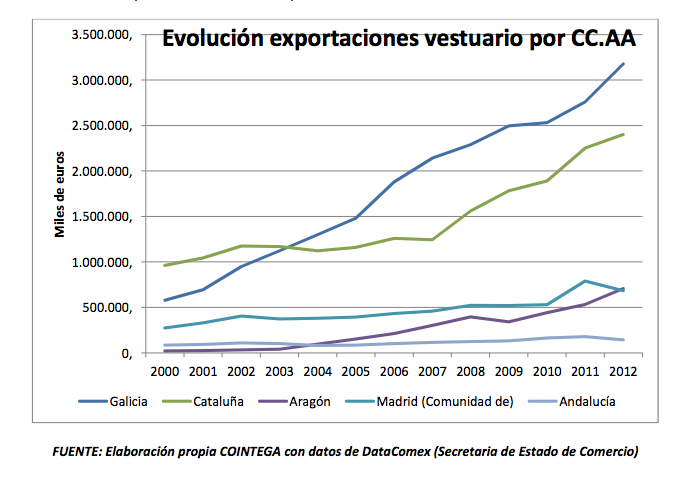
De acuerdo con estos últimos datos, Galicia sigue afianzando su posición de liderazgo en cuanto a exportaciones de vestuario, aumentando su diferencia con respecto a Cataluña, cuyo incremento ha sido del 7 %, así como en relación a Madrid y Andalucía que sufren unos retrocesos del -14 % y -20 % respectivamente. Siendo destacable la buena evolución de Aragón, con un incremento del 33 %, que este año ha superado a Madrid, consiguiente un volumen de exportaciones similar al que tenía Galicia en el año 2001.
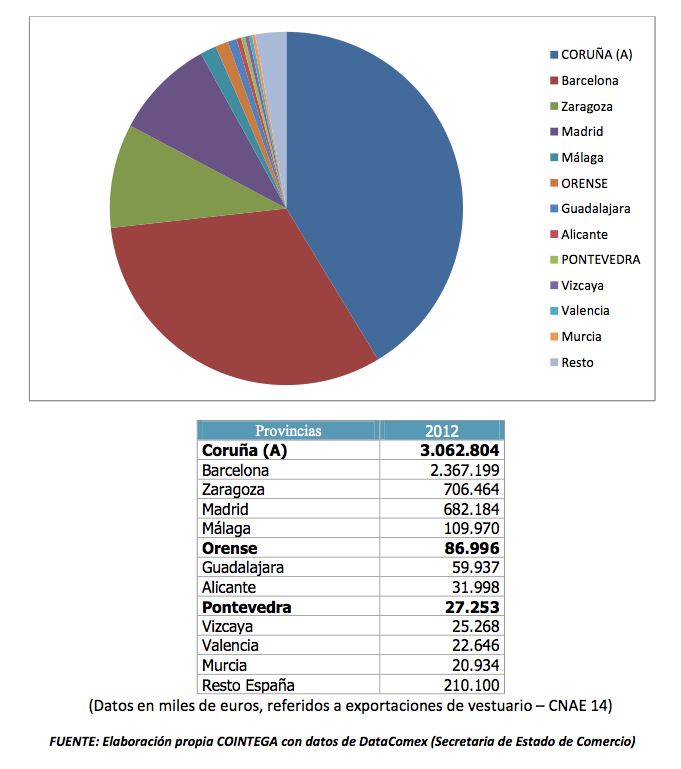
Con objeto de encuadrar convenientemente el efecto Inditex, que obvia decir que juega en otra liga, resulta esclarecedora la desagregación de estas cifras a nivel provincial, donde se pone de manifiesto que las dos provincias donde este grupo tiene los domicilios fiscales de sus principales cadenas (Coruña y Barcelona) aportan el 73 % de las exportaciones españolas, y que la subida de Zaragoza al tercer puesto coincide con la entrada en funcionamiento de un nuevo centro logístico de esta compañía en dicha ciudad.
Hechas estas consideraciones, vale la pena destacar que Galicia tiene situadas otras 2 provincias, Orense y Pontevedra, en las que no existe efecto Inditex, en el top 10 español, siendo la única comunidad que cuenta con más de una en posiciones relevantes.
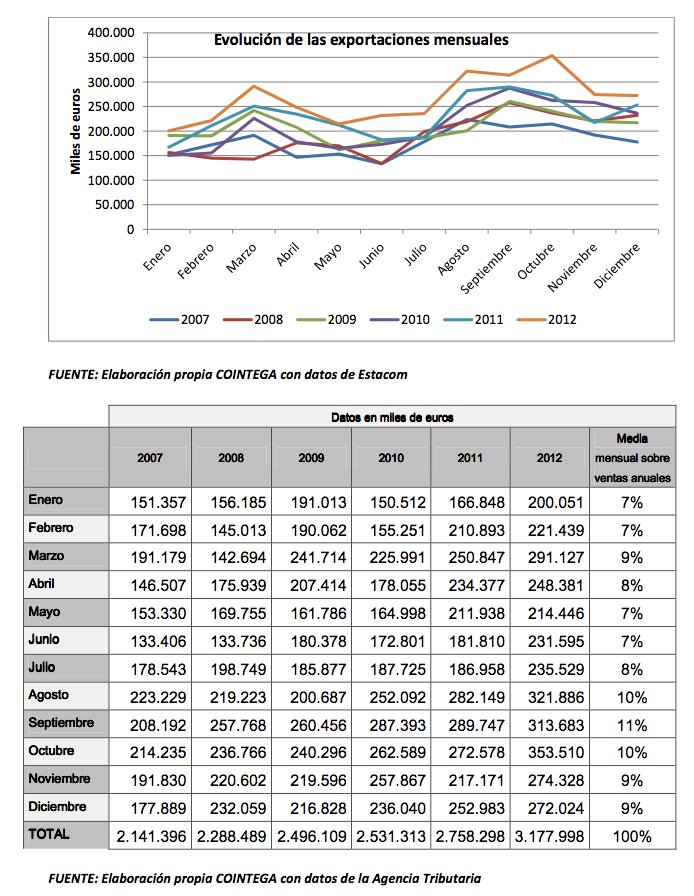
A través del análisis de la evolución mensual de las exportaciones, podemos extraer algunas conclusiones tanto en lo que se refiere a los canales utilizados como al modelo de negocio.
En este sentido, conviene recordar que tradicionalmente las empresas expedían y facturaban sus exportaciones antes del inicio de cada temporada, de manera que existía una fuerte estacionalidad y concentración de las cifras de exportación en los meses de agosto y septiembre, por las entregas a las tiendas del producto de otoño-invierno, y en los meses de febrero y marzo, por las entregas del de primavera-verano.
Sin embargo, como puede observase en el siguiente gráfico y tabla que lo acompaña, la media en los últimos 6 años, de las exportaciones en los meses de agosto y septiembre, solamente suponen el 21 % del total anual, y las de febrero-marzo un 16 % (el precio medio de las prendas de verano es siempre más bajo que el de las de invierno).
Es decir, la estacionalidad ha quedado notablemente atenuada, ya que la diferencia entre los meses más flojos, que están en un 7 % del total anual, y los de más exportaciones, que suponen un 11 %, solo existen 4 puntos de diferencia.
Estos datos evidencian dos realidades, por una parte el control sobre la cadena de valor y por otra la existencia de una alta rotación en el producto.
En cuanto a los canales de distribución, la apuesta por la tienda propia o franquicia, son los que explican este comportamiento tan regular en las exportaciones.
 Distribución por tipo de producto
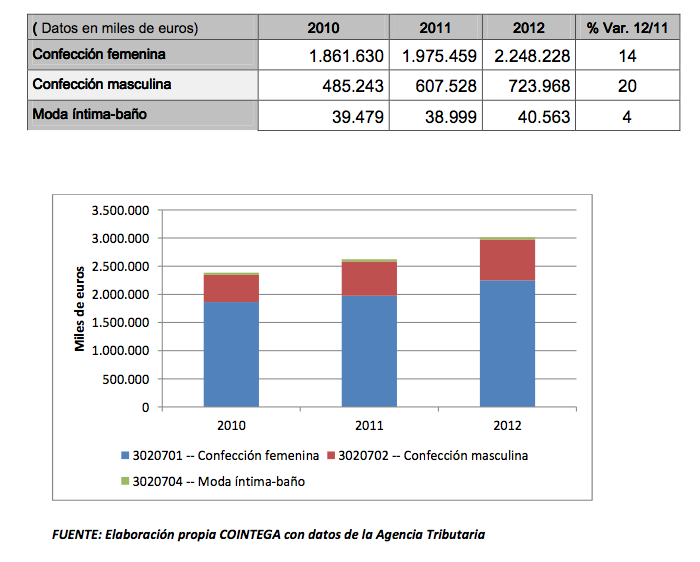
Por lo que se refiere a tipología de producto, resulta abrumadora la importancia de la confección femenina, aunque la masculina sigue reduciendo distancia a base de crecer más rápido, habiéndose incrementado en el último año las exportaciones de hombre en un 20 %, frente al 14 % alcanzado por las de mujer.
 Logística de Envío
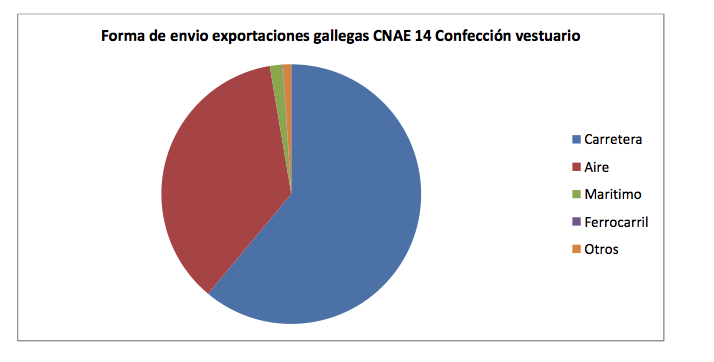
La siguiente tabla muestra cuales son los medios de transporte empleados en las exportaciones, donde puede observarse el absoluto predominio de la carretera y el aéreo, por ser los medios que permiten una mayor rapidez y flexibilidad logística.
Aunque existen algunas diferencias a nivel provincial, las mismas vienes explicadas por factores de acceso infraestructuras y de tipología de empresas. De todas formas, es importante poner en relación estos porcentajes con los valores en términos absolutos, ya que el 2 % de envíos marítimos realizados desde Coruña representan un mayor número de prendas que el 19 % del porcentaje de exportaciones realizadas desde Pontevedra por este mismo medio.

Para el conjunto de las exportaciones gallegas, la distribución es la mostrada en el siguiente gráfico:
 Diferencias provinciales
El sector textil moda gallego se encuentra muy disperso por la geográfica, con predominancia en tres provincias, que además tienen características singulares en función de la existencia en ellas de alguna tipología de empresa dominante.
Así, en el caso de Coruña, los datos estadísticos son los referidos al Grupo Inditex, que ensombrecen por completo los aportados por el resto de las empresas radicadas en esa provincia.
Por lo que respecta a Orense, ocurre prácticamente lo mismo con los volúmenes aportados por STL y AD.
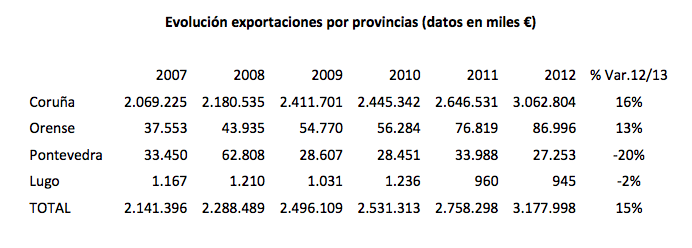
Sin embargo, el caso de Pontevedra, donde los datos de exportación de B&L todavía no resultan apabullantes, podemos considerarlo como una muestra representativa de lo que esta ocurriendo con las pymes gallegas del sector, con un resultado que no puede ser más desolador, como como pone en evidencia el siguiente cuadro:
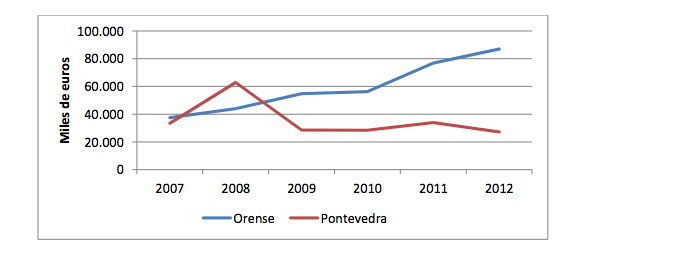
En el siguiente gráfico, donde se muestra la diferente evolución durante los últimos años de las exportaciones de las empresas orensanas, fundamentalmente STL y AD, con respecto a Pontevedra, pone en evidencia las diferencias entre dos modelos, cuyas notas características serían las siguientes:

Así, parece que una de las claves del éxito en la exportación lo encontramos en la dimensión de la empresa y en basar la estrategia de acceso a los mercados exteriores en el concepto de tienda y no en el producto, que se ha convertido en una condición necesaria pero no suficiente.
En todo caso, también hay que señalar que existen algunos casos (constatados personalmente) de empresas de reducida dimensión, que con una estrategia de nicho, accediendo a tiendas multimarca modernas, con un producto bien hecho y “bonito” están consiguiendo resultados razonablemente buenos.
Por otra parte, además del hecho relatado en apartados anteriores sobre el incremento del número de empresas que han realizado alguna exportación en el último año, donde Pontevedra tiene una situación de liderazgo, también resulta interesante observar la evolución del importe medio facturado en cada operación de exportación.
Este dato lo obtenemos dividiendo el total de la exportación anual entre el número de operaciones realizadas en cada uno de los años, dando como resultado el siguiente cuadro:

En una primera interpretación, parece que cuando se exporta a una tienda propia, las cantidades enviadas en cada operación son menores que cuando se vende a un cliente con el que no existe vinculación. De todas formas, el dato parece interesante para que cada empresa pueda compararlo con su propia realidad.
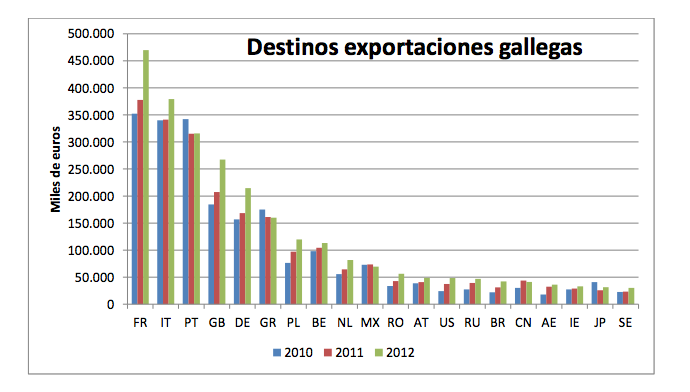
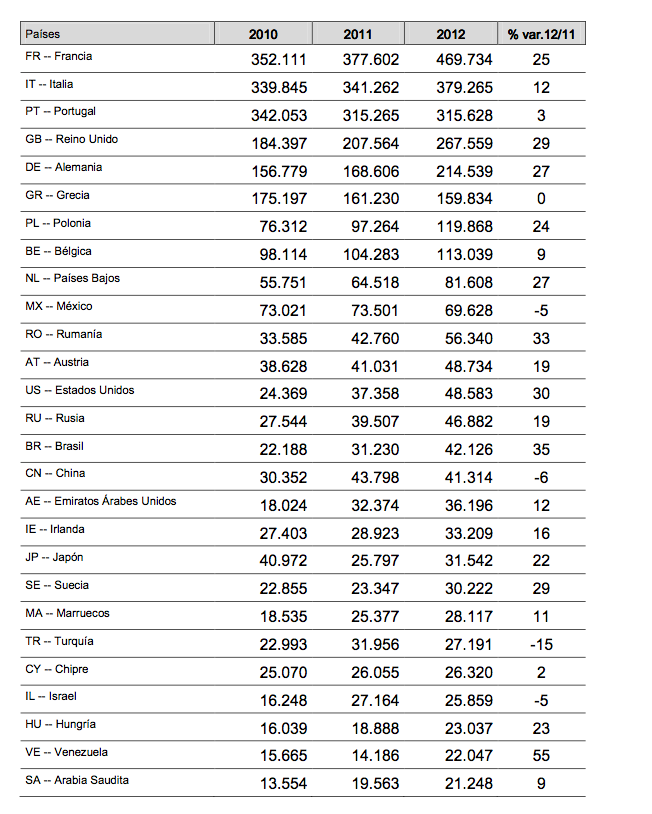
Aunque los principales mercados continúan siendo los países vecinos de España, el nivel de diversificación es cada vez mayor, habiéndose realizado en el año 2012 exportaciones a 104 países, aunque con grandes diferencias en cuanto a los volúmenes.
En todo caso, un buen indicador para medir esta tendencia hacia la diversificación, es analizar la evolución del porcentaje exportaciones que representan los 10 principales mercados sobre el total:

A la vista de las cifras en cada uno de estos 104 mercados, se observan claramente dos estrategias de actuación, por una parte, la consolidación vía mayor penetración en mercados maduros, y, por otra, las altas tasas de crecimiento, pero aun con pequeños volúmenes en nuevos mercados emergentes.
En este sentido, los mayores crecimientos porcentuales se han producido en las exportaciones a Perú, Sudáfrica y Ecuador.
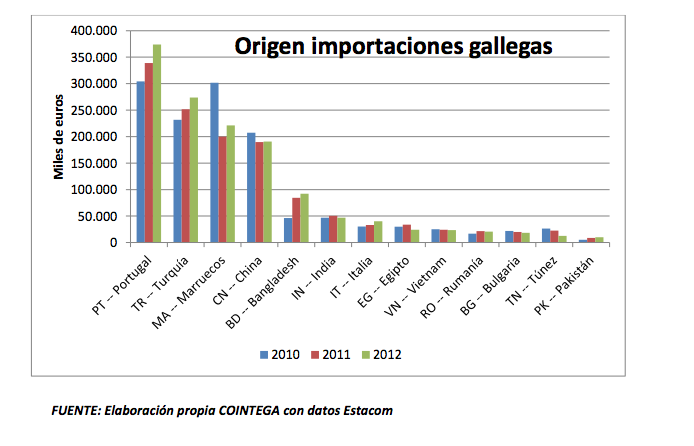
Por lo que respecta al origen de las importaciones en Galicia se consolida la tendencia a la producción de proximidad, en los países de nuestro entorno, que configuran una especie de cinturón industrial del sector textil-moda gallego, con una especial relevancia del caso de Portugal, que es el país donde más se están incrementando las compras.
Este efecto esta suponiendo también un retorno de producción a Galicia, especialmente a fábricas que han sabido modernizarse y alcanzar un tamaño crítico para resultar eficientes.
De todas formas, también hay que tener en cuenta que algunas producciones realizadas en lugares lejanos, ya se están enviando directamente a los mercados donde las prendas se pondrán a la venta, siendo esta una tendencia general de las compañías con punto en venta propios o en franquicia, con independencia de su tamaño.
Además de las ayudas de ICEX y otros organismos, dentro del plan estratégico sectorial realizado por el Clúster en colaboración con la Conselleria de Economía e Industria de la Xunta de Galicia, se han articulado dos grandes líneas de actuación, que se definen del siguiente modo:
Un claro ejemplo de las primeras, es la orden de apoyo a la promoción e internacionalización de las empresas del sector textil-confección-moda, que con una dotación presupuestaria anual media de 1 millón de euros, permitió que en el año 2012 se apoyase a un total de 36 empresas, con una subvención media de unos 25.000 euros para inversiones relacionadas con su presencia en ferias, prospección comercial y otras actuaciones de marketing internacional.
Por lo que se refiere a las acciones focalizadas, para este año 2013 resulta destacable el Plan América, que tiene como mercados objetivos de primer nivel a Colombia y México, para el que existe una dotación de 378.000 euros, financiados al 100 % por el IGAPE a través de un convenido entre este organismo y COINTEGA.
Los diagnósticos sobre el potencial de internacionalización para empresas del sector moda, también financiados al 100 % por el IGAPE es otra interesante línea de específica apoyo.
Finalmente, dentro de las ayudas comunes a otros sectores, resulta especialmente destacable la referida a Gestores de Exportación, a través de la cual las empresas pueden contratar directamente a uno de los profesionales que figuran en las bolsas del Igape, así como utilizar los servicios de los gestores contratados por Cointega, que centran su labor fundamentalmente en las empresas de menor tamaño y experiencia.
2026 © Cointega. Política de privacidad Política de Cookies